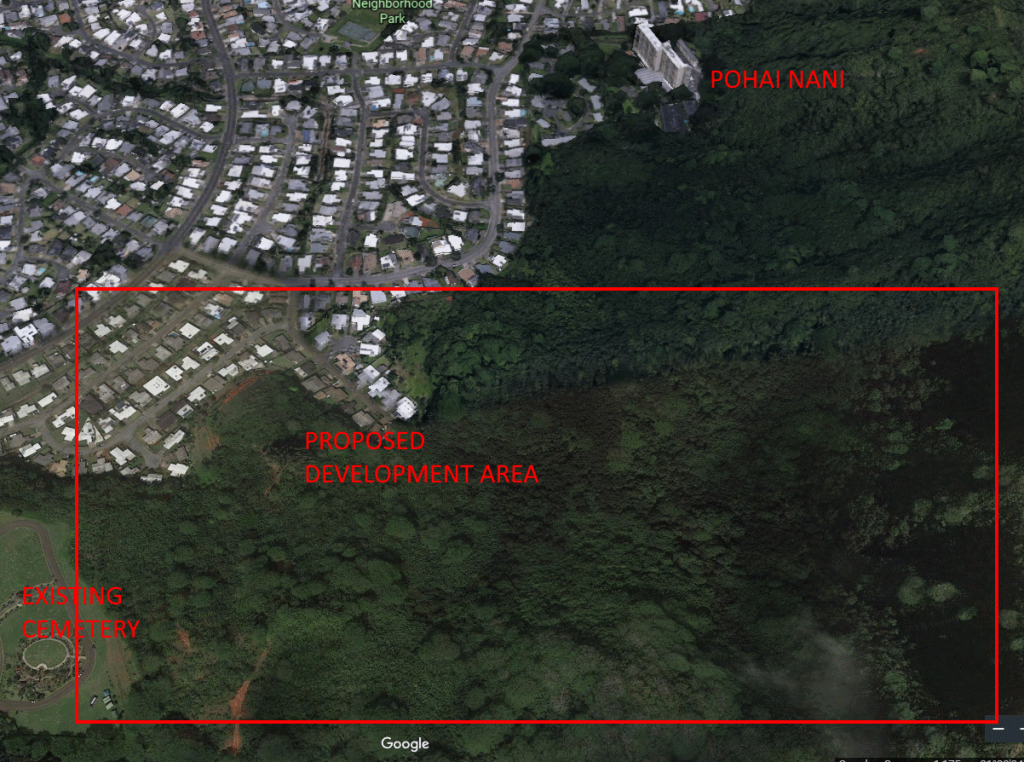
Planned Development Area
This diagram shows the planned development area.
Concept Diagram
This diagram shows the what the development will look like. (This diagram is from the HMP Draft Environmental Impact Statement).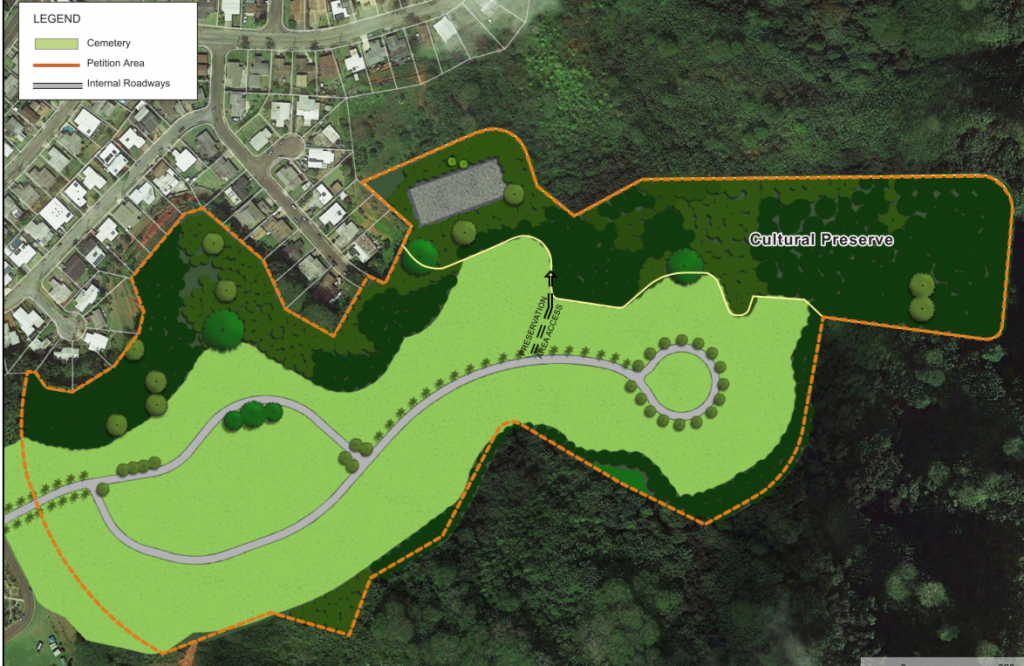
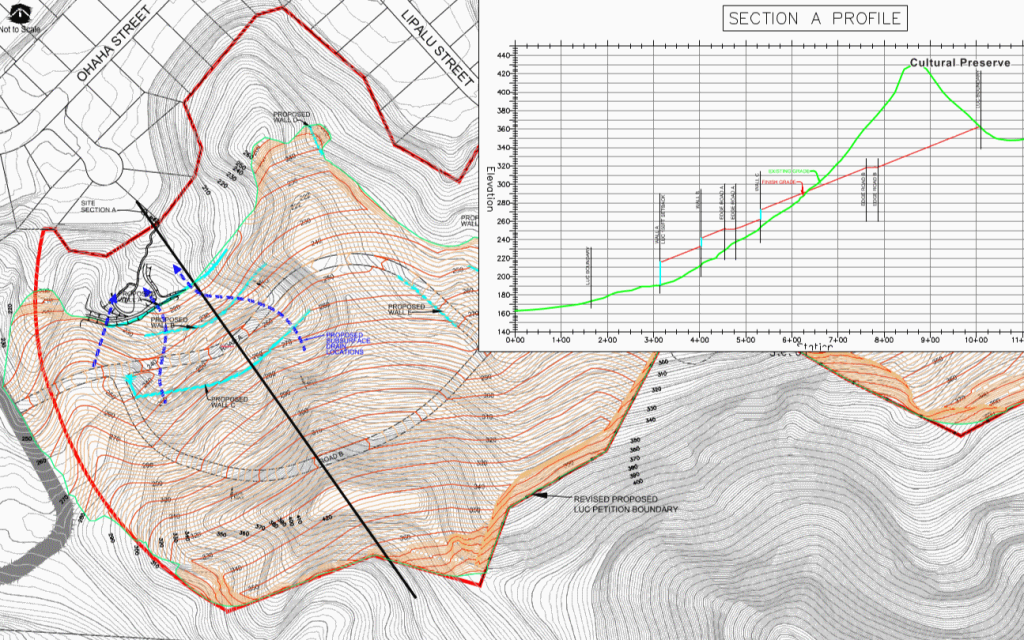
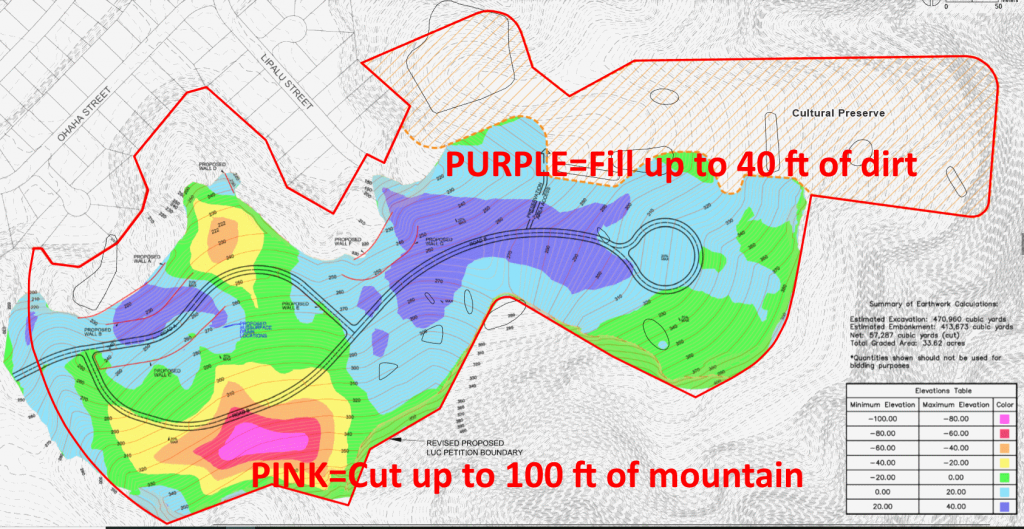
Deforestation and Earth Movement
This diagram shows how much Earth will be moved. The entire shaded region will be deforested. Pink, Red, Orange, and Yellow show GRADING. Green, Blue, and Dark Blue represent FILLING. (This diagram is from the HMP Draft Environmental Impact Statement).
Cross Section
Here’s a cross section view, showing how much of the hill they will remove. (This diagram is from the HMP Draft Environmental Impact Statement).
BLACK ARROW (on underlying diagram) – shows the cross section view
BLUE – Retention Walls, requiring back-fill. (on inset and underlying diagram)
GREEN – current hill (on inset diagram)
RED – The new cut hill(on inset diagram)